The VC Corner
The Investor Dashboard Most Founders Spend Weeks Building — Yours in 3 Steps
Ruben Dominguez
Apr 24, 2026
The Investor Dashboard Most Founders Spend Weeks Building — Yours in 3 Steps
Source: The VC Corner · Author: Ruben Dominguez · Date: 2026-04-24 · Original post
Note: This post is partially paywalled. The summary below covers the public/preview portion of the article.
The problem: a great company hidden behind a bad-looking spreadsheet
Most founders walk into investor meetings with "a spreadsheet and a prayer." The numbers exist, the story exists — but nothing on screen looks like it belongs to a company worth backing. The financial model is buried somewhere deep in Excel, the cap table sits on a separate tab, and the runway chart looks like it was drawn in 2014.
The author's argument is blunt: investors form impressions fast, and the presentation layer matters more than founders want to admit. A VC who sees hundreds of decks a month decides in the first two minutes whether your story is "legible." If the numbers are right but the visuals scream amateur, you've already lost ground before anyone reads a single figure.
This is why polish is signal, not vanity. A clean dashboard communicates three things before a single question is asked:
- This founder understands their metrics.
- This company tracks the right things.
- This team is ready to be scrutinized.
That impression is set before due diligence begins — and it shapes every conversation that follows.
The fix: The VC Corner Dashboard Generator
The VC Corner built a tool to close the gap between "I have the numbers" and "this looks like a $10K-deck-deck." You fill in an Excel template, drop the file into a browser, and the tool turns your 5-year projections into an investor-grade dashboard instantly.
What it covers
The generator ships 58 financial sections, 10 chart types, and 3 business-model presets, so the metrics shown are the ones investors in that sector actually scan for:
- AI-SaaS — MRR (monthly recurring revenue), ARR (annual recurring revenue), churn, NDR (net dollar retention — how much existing customers expand vs. shrink), CAC/LTV (cost to acquire vs. lifetime value of a customer), Rule of 40 (growth % + profit margin % should exceed 40), burn multiple (how much cash you burn per dollar of new ARR), headcount, and token cost per customer (a newer AI-era unit-economics metric — what each user costs you in model inference).
- D2C (direct-to-consumer) — GMV (gross merchandise value), AOV (average order value), channel revenue, return rates, cohort retention, unit economics, and the standard P&L / balance sheet / cash flow trio.
- Healthcare — bed occupancy, ARPOB (average revenue per occupied bed), department revenue, payer mix, OPD/IPD volumes (outpatient vs. inpatient), doctor productivity, and patient satisfaction.
The point of having three presets is that a generic template forces founders to either over-explain or hide metrics. A vertical-specific dashboard speaks the language the investor already uses.
What investors actually see
Every dashboard includes:
- A VC Readiness Score out of 100 — a single headline number summarizing how investable your metrics look.
- A 6-axis radar chart benchmarking you against what top investors expect on revenue growth, gross margin, NDR, LTV/CAC, Rule of 40, and runway. A radar chart is useful here because it shows shape at a glance — investors immediately spot if you're strong on growth but weak on retention, for example.
- A full KPI strip across the top, interactive charts with hover tooltips, YoY (year-over-year) badges on every section so deltas are visible without doing math, and one-click PDF export in landscape format for sending to investors.
How it works — the three steps
- Download the blank Excel template.
- Fill in your company details and 5-year projections in the blue cells (the blue-cell convention is a standard finance pattern — blue = input, black = formula, so you can't accidentally break the model).
- Upload the file and the dashboard renders instantly.
Built for privacy
The whole thing is 100% client-side — it runs entirely in the browser. No sign-up, no server upload, no data sharing. Your projections never leave your device. This matters because financial projections are some of the most sensitive data a startup has, and most "free dashboard" tools quietly ingest your numbers into their cloud.
Why this matters before your next raise
The author closes the public section with the core thesis: founders already using this walk into fundraising conversations with something that looks like it cost $10,000 to build, even though it costs nothing and takes minutes. In a world where investors pattern-match on signal, presentation polish is one of the cheapest, highest-leverage edges a founder can buy — especially when the underlying numbers are already solid.
Access (paywalled)
The tool itself is gated behind a premium subscription to The VC Corner, which also bundles their investor list (10,000+ VCs), a library of real pitch decks from companies that raised billions, dozens of financial models, and the rest of the publication's framework/template archive. A 7-day free trial is offered, with a 50% lifetime discount for early subscribers.
Takeaway for builders: Even if you never use this specific tool, the underlying lesson is portable — when you're raising, invest a few hours in the presentation layer of your metrics. A radar chart, a readiness score, YoY deltas, and a clean PDF export turn the same numbers into a dramatically stronger first impression. The math doesn't change; the signal does.
Author
Ruben Dominguez
Continued reading
Keep your momentum
MKT1 Newsletter
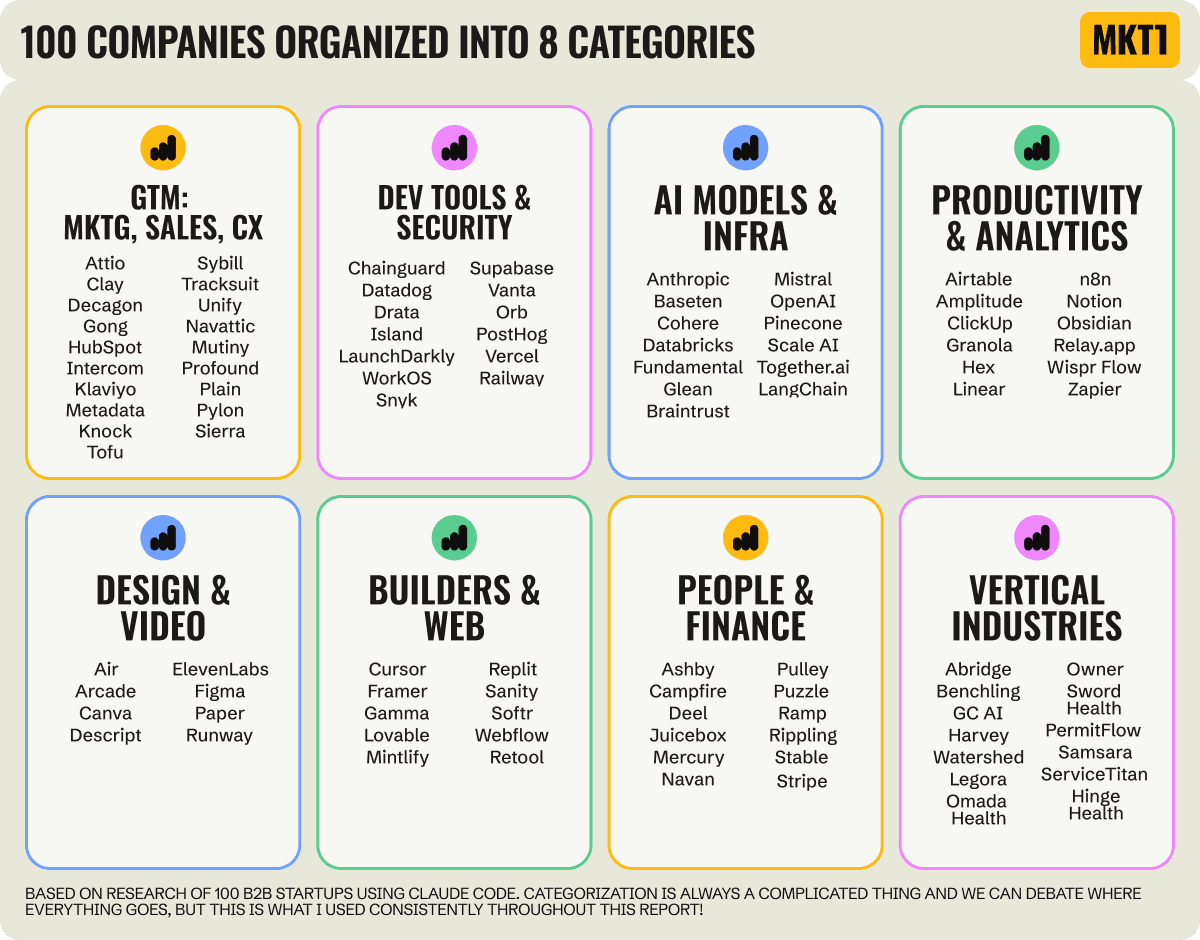
100 B2B Startups, 100+ Stats, and 14 Graphs on Web, Social, and Content
This is Part 2 of MKT1's three-part State of B2B Marketing Report. Where Part 1 looked at teams and leadership , Part 2 turns to what marketing teams are actually doing — what their websites look like, how they use social, and what "content fuel" they're producing. Emily Kramer u
Apr 28 · 10m
Lenny's Newsletter (Lenny's Podcast)
Why Half of Product Managers Are in Trouble — Nikhyl Singhal on the AI Reinvention Threshold
Nikhyl Singhal is a serial founder and a former senior product executive at Meta, Google, and Credit Karma . Today he runs The Skip ( skip.show (https://skip.show)), a community for senior product leaders, plus offshoots like Skip Community , Skip Coach , and Skip.help . Lenny de
Apr 27 · 7m

The AI Corner
The AI Agent That Thinks Like Jensen Huang, Elon Musk, and Dario Amodei
Dominguez opens with a claim that is easy to skim past but worth stopping on: the difference between elite founders and everyone else is not raw IQ or speed — it is that each of them has internalized a repeatable mental procedure they run on every important decision. The procedur
Apr 27 · 6m