MKT1 Newsletter
100 B2B Startups, 100+ Stats, and 14 Graphs on Web, Social, and Content
Emily Kramer
Apr 28, 2026
100 B2B Startups, 100+ Stats, and 14 Graphs on Web, Social, and Content
Source: MKT1 Newsletter · Author: Emily Kramer · Date: Apr 28, 2026 · Original article
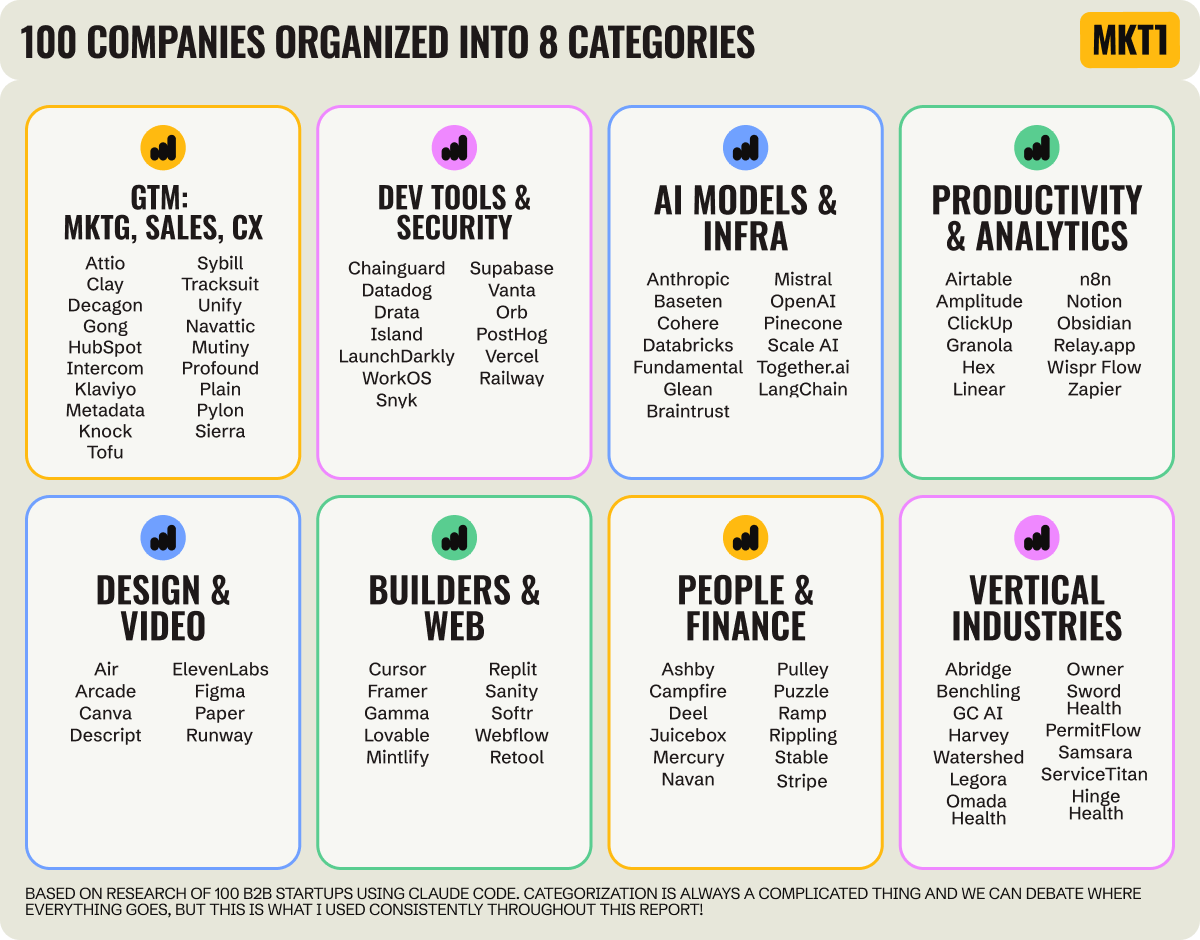
This is Part 2 of MKT1's three-part State of B2B Marketing Report. Where Part 1 looked at teams and leadership, Part 2 turns to what marketing teams are actually doing — what their websites look like, how they use social, and what "content fuel" they're producing. Emily Kramer used Claude Code to scrape and analyze 100 fast-growing B2B startups (homepages, hero sections, pricing pages, CMSs, careers pages, LinkedIn followers, LinkedIn ad libraries, schema markup, etc.) and broke the data down by company size, GTM motion (sales-led vs. hybrid vs. self-serve), and 8 audience/function categories.
Two pieces of vocabulary that recur throughout:
- CMS (Content Management System): the layer that lets a marketer change a headline or swap a logo without bothering an engineer. All-in-one CMSs (Framer, Webflow) bundle the design tool and the content tool together. Headless CMSs (Sanity, Contentful) are just the content tool — paired with a custom front-end that engineers build separately.
- GTM motion: how a company sells. Sales-led = talk-to-sales/demo. Self-serve = sign up and pay yourself. Hybrid = both.
Methodology caveats worth holding in mind: the 100 companies were curated (meant to represent "the top"), not random; the 8 categories are subjective groupings; and some scraped data points will have errors.
Part A — The State of B2B Websites
What are sites built on? Has vibe coding taken over?
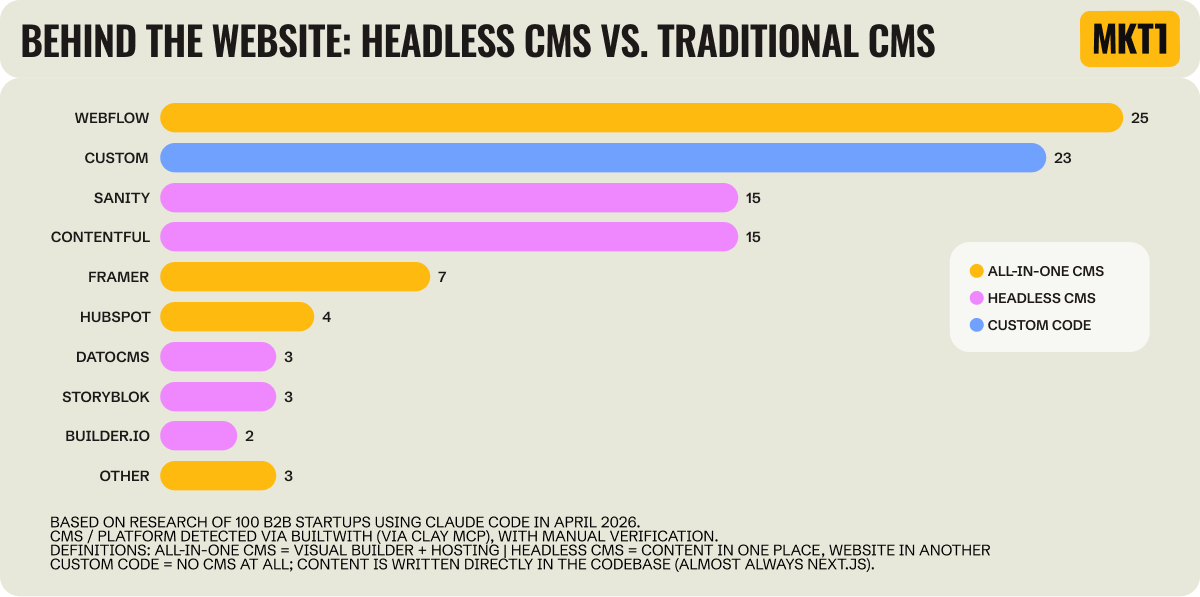
- 39% of B2B sites are still on all-in-one platforms; 38% on headless CMS (Sanity 15%, Contentful 15%, others combined); 23% have no CMS at all (mostly Next.js code where engineers manage content directly).
- Webflow alone is 25% — the single most common builder across the whole sample, not just within the all-in-one bucket.
- The 23% with no CMS are very likely teams where marketing is annoyed at how hard it is to update the site. GTM-category companies (5%) and people/finance companies (8%) almost never go custom — the rule is: if your product isn't technical, your website probably isn't either.
- Vibe coding hasn't replaced the traditional CMS — yet. Zero of the 100 companies built their primary site with an AI builder like Lovable or Bolt. Some likely use them for secondary sites or landing pages.
- Among companies under 50 employees, 45% have no CMS — these are the ones most likely to skip hiring a developer next year and just ask Claude Code to make the change.
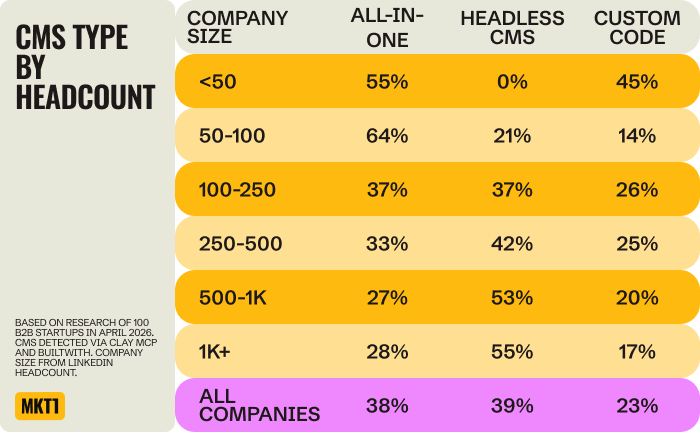
- The bigger the company, the more likely it's headless. At 50–100 employees only 21% are on a headless CMS; at 1,000+ it's 55%. Once a marketing team has 15+ people, headless lets engineers build whatever front-end they want while marketers update content separately.
- All-in-one CMS peaks at 64% in the 50–100 employee bucket — the same bucket where (per Part 1) the median marketing team jumps from 1 to 4. Translation: founder ships a custom-coded site → first marketing hire kills it and moves to all-in-one → at scale, engineering wins back control via headless.
What's in the hero?
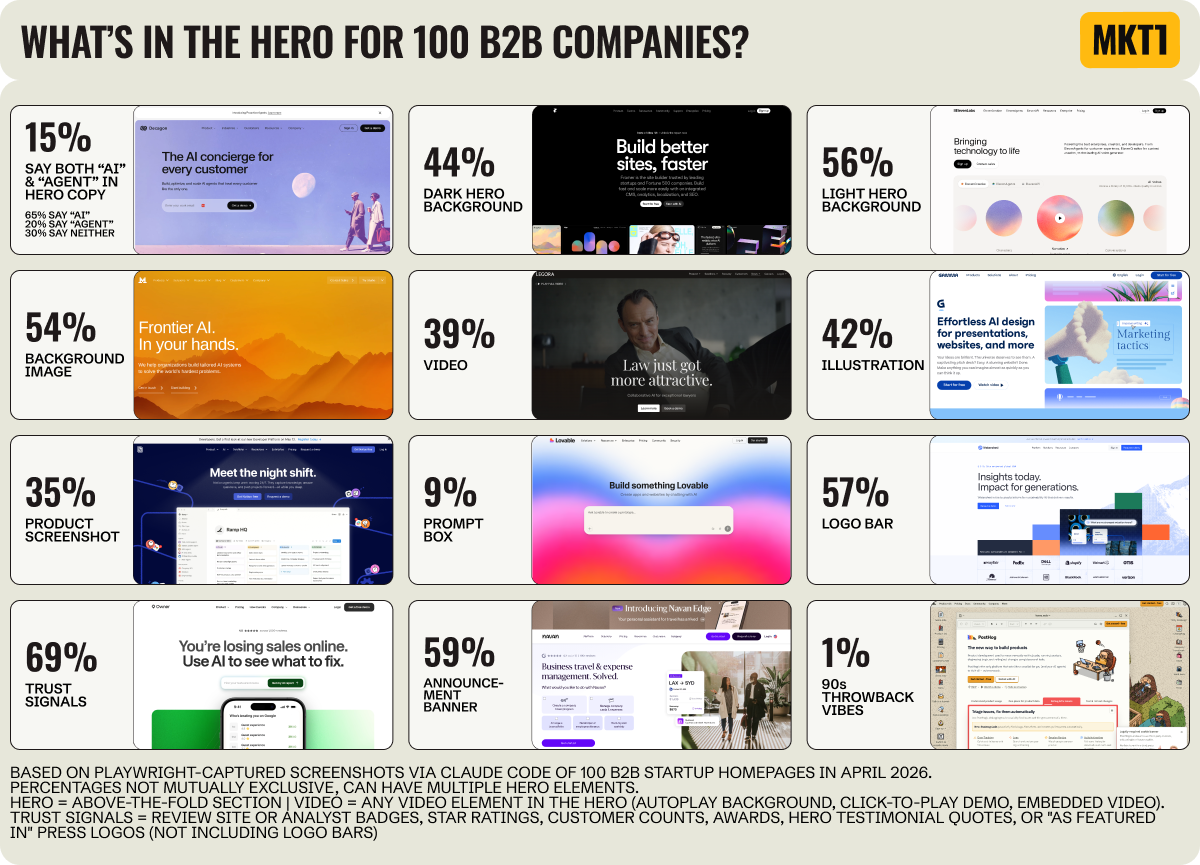
- Sales-led companies hide their product. Only 22% put a product screenshot in the hero, vs. 39% for everyone else; hybrid is 37%, self-serve 57%. Sales-led heroes lean on background images (74%) or videos (57%) instead, plus announcement banners (70%) — likely because "request a demo" is a heavy ask, so they need a lighter secondary CTA.
- The standard "above the fold" kit on a B2B home page: a logo bar (58%), a trust signal (69% — review badges, customer counts, awards, star ratings, testimonial quotes, or press logos), and an announcement banner (59%).
- "AI" is in 65% of hero copy, but a prompt-style text box in the hero is rarer than expected — only 9 companies have one, and all 9 have a self-serve or hybrid motion.
- Standout heroes: Legora puts Jude Law in a full-bleed video (leaning into the law pun); Owner asks restaurant owners to type their restaurant name in for a custom AI sales report (the only prompt-box company not targeting tech buyers); Navan stacks 8 of the 9 hero elements tracked plus a multiple-choice selector and a giant announcement bar.
What do homepages say?
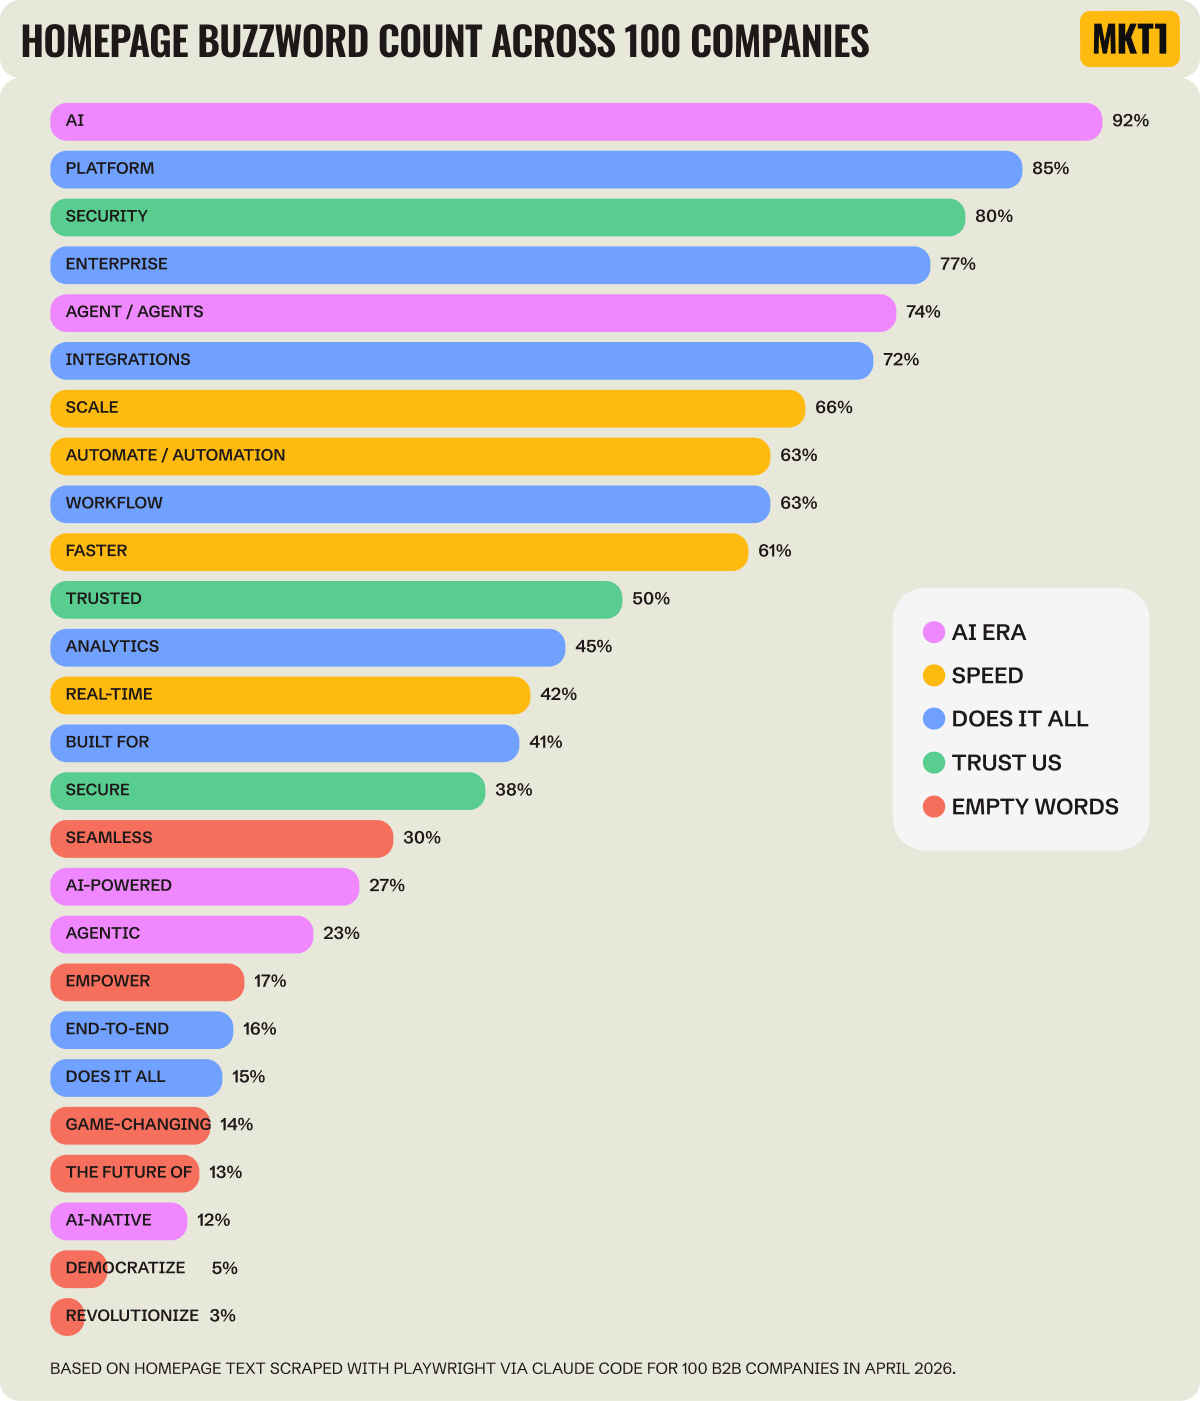
- We're all "AI platforms" now. 92% of B2B homepages say "AI"; 66% say "platform"; 75% say "agent" or "agentic" (52 say "agent" only, 19 say both).
- Only 5 companies don't mention AI or agents anywhere on the homepage: Obsidian, Omada Health, Pulley, ServiceTitan, and Tracksuit.
- Buzzword fatigue check: "revolutionize" (3%), "game-changing" (13%), "democratize" (5%), and "seamless" still on a stubborn 30% of homepages.
Does everyone finally have a pricing page?
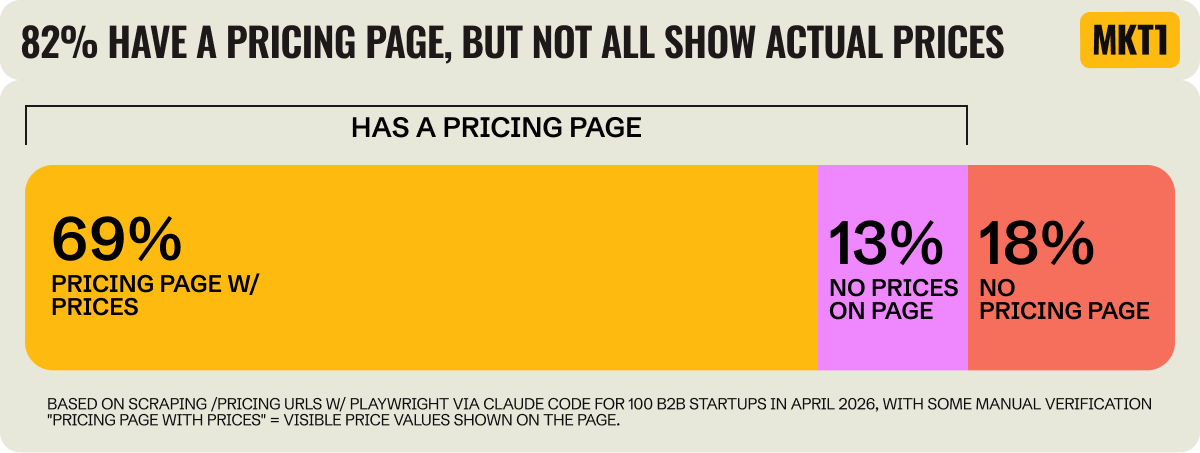
- 82% of B2B companies have a pricing page, finally. Most starting tiers are $10–$30/mo. Notable points: ClickUp's lowest seat-based plan is $7/user/mo; Together.ai bills $0.02 per million tokens; Pulley quotes annually ($1,200/yr for equity management).
- More money raised → less likely to show prices. 90% of companies that raised $50–100M show prices, but only 57% of $500M–1B companies do — the enterprise sales playbook takes over once you raise serious money. Public companies bounce back to 80% (skewed because 4 of the 5 publics are hybrid).
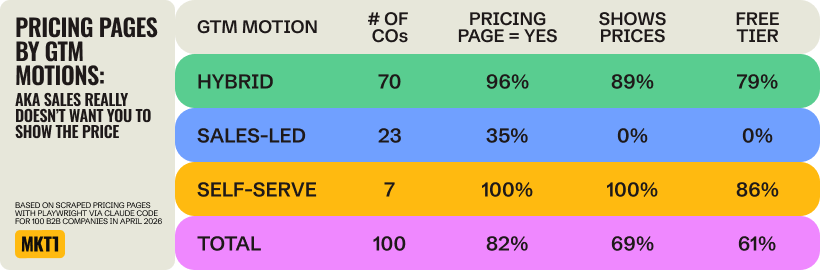
- GTM motion is almost a perfect predictor of having a pricing page. Sales-led companies that do have a pricing page show actual prices on 0% of them. Emily's argument: buyers will ask an LLM for your pricing anyway — better to have it on your site, accurate, than guessed by a model.
Is usage-based pricing taking over?
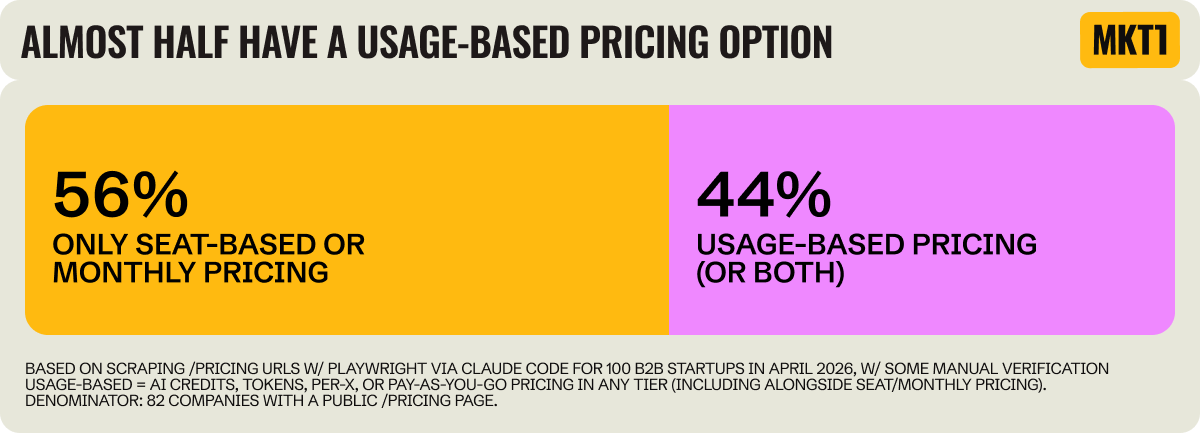
- 36 of 100 companies have usage-based pricing (28 only usage-based — 34% of the companies with pricing pages — and 9 with both usage and seat-based, 11%).
- 7 of 8 categories have at least one usage-based company. Design & Video uses it most (75%); Vertical Industries has zero.
- Different shapes of usage-based: Together.ai (per token), Stripe (per transaction), Intercom + Fin (per outcome — billed per AI-resolved ticket).
Web takeaways: Sites are getting cheaper and faster to build, but most companies still sit on legacy CMSs or custom code. Sales-led companies keep hiding pricing and product — and as inbound shrinks while 77% of B2B startups offer self-serve, that hiding probably costs revenue. Usage-based pricing is rising specifically to absorb AI inference costs.
Part B — The State of B2B Social
Do founder socials matter more than company socials?
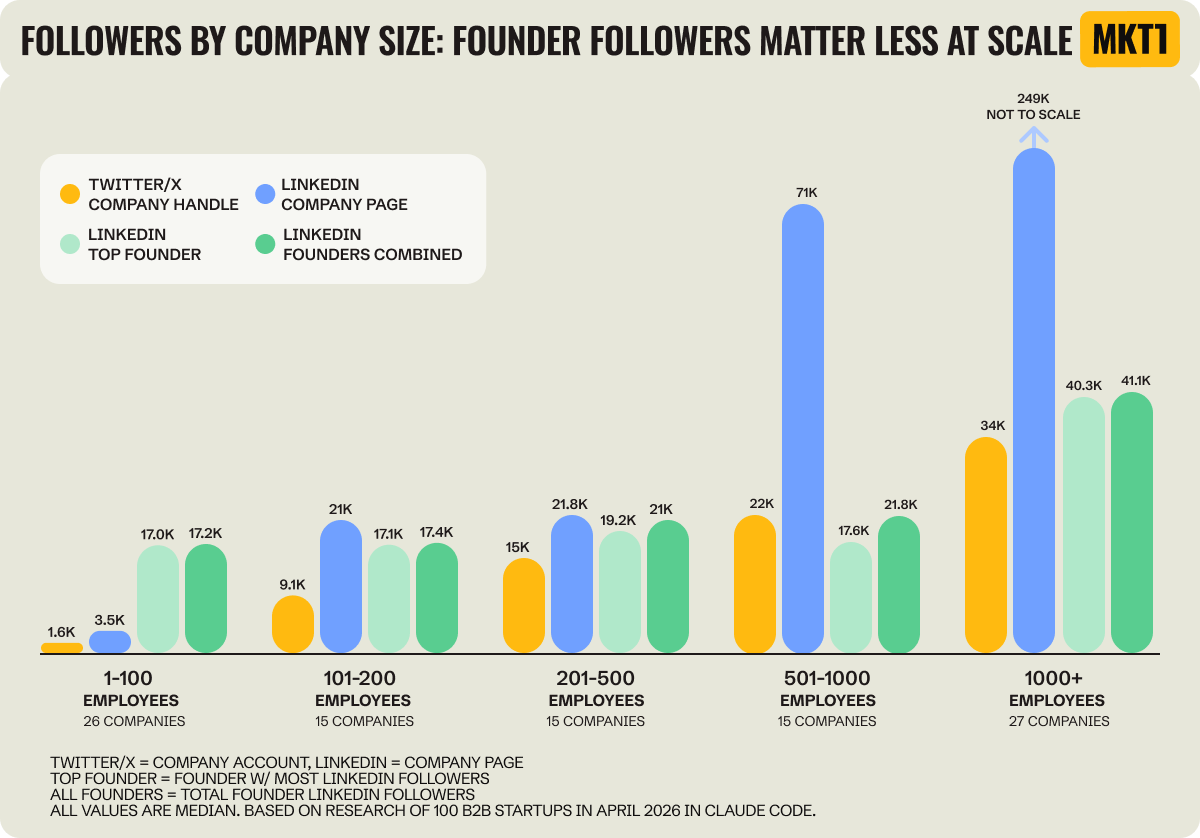
- At small companies the founder is bigger than the brand; at scale, it flips. 73% of founders at sub-50-person companies have more LinkedIn followers than their company; at 1,000+ employees, only 7% do. The crossover is around 250 employees.
- Another lens: founders out-follow their company by 2–3x at small companies; by 1K+ the company has 4–5x the founder's followers.
- Most extreme founder dominance (all under 100 employees): Relay.app (185x), GC AI (160x), Metadata (135x), Unify (26x), Sierra (17x). Caveat: late-stage companies likely built their LinkedIn following back when growing a company page was easier; the platform now favors individuals.
- One founder usually carries the social weight. Median top founder has 22.7K LinkedIn followers; combined median across all founders is 27.4K — so 2nd and 3rd founders only add ~20% on top.
Is Twitter still alive for B2B?
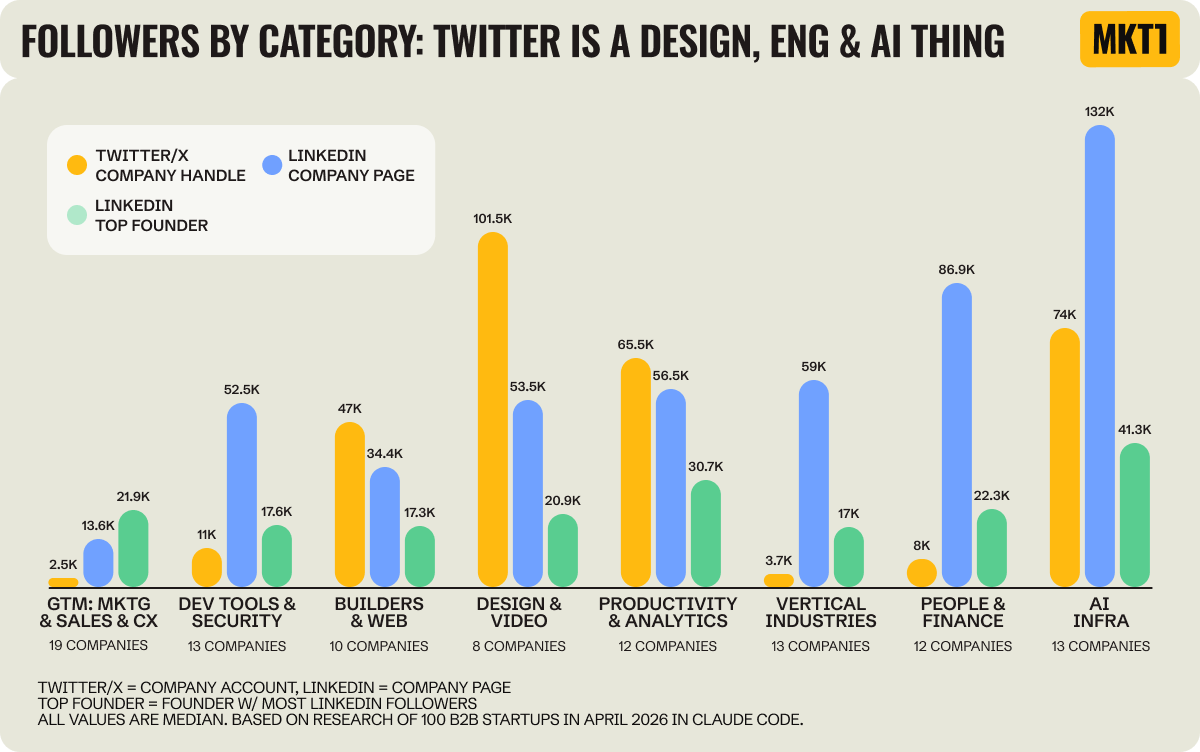
- Pattern: technical and creative audiences hang out on Twitter; business buyers (HR, finance, ops) live on LinkedIn.
- Twitter beats LinkedIn (in median followers) in 3 categories: Design & Video (101K vs 53K), Builders & Web (47K vs 34K), Productivity & Analytics (65K vs 56K).
- Twitter is effectively dead in 3 categories: GTM (2.5K median), Vertical Industries (3.7K), People & Finance (8K).
How prevalent are LinkedIn ads?
- The median company has 386 ad creatives visible in the LinkedIn Ad Library (12-month window). Three companies break 10K: Canva, Rippling, ElevenLabs.
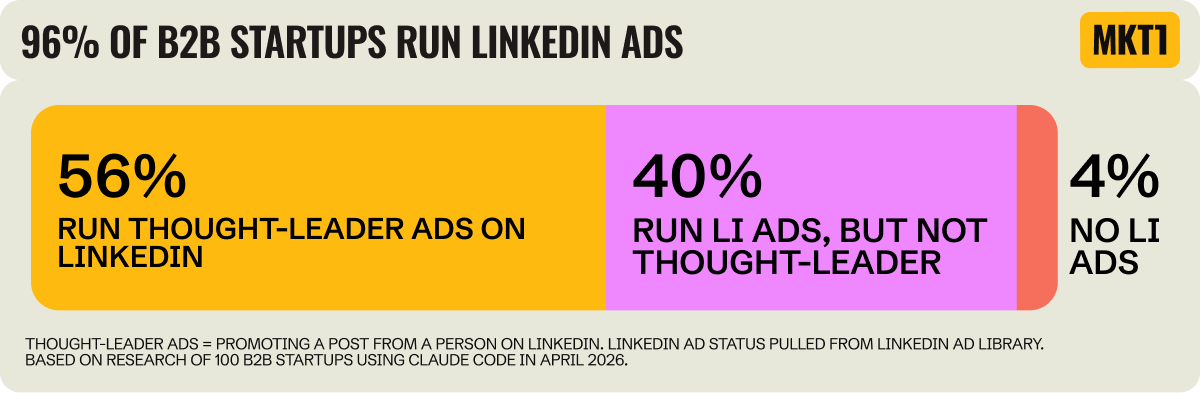
- 96% run LinkedIn ads. Only 4 of 100 skip it; 2 of those (Relay.app, Obsidian) compensate with massive organic founder/Twitter followings.
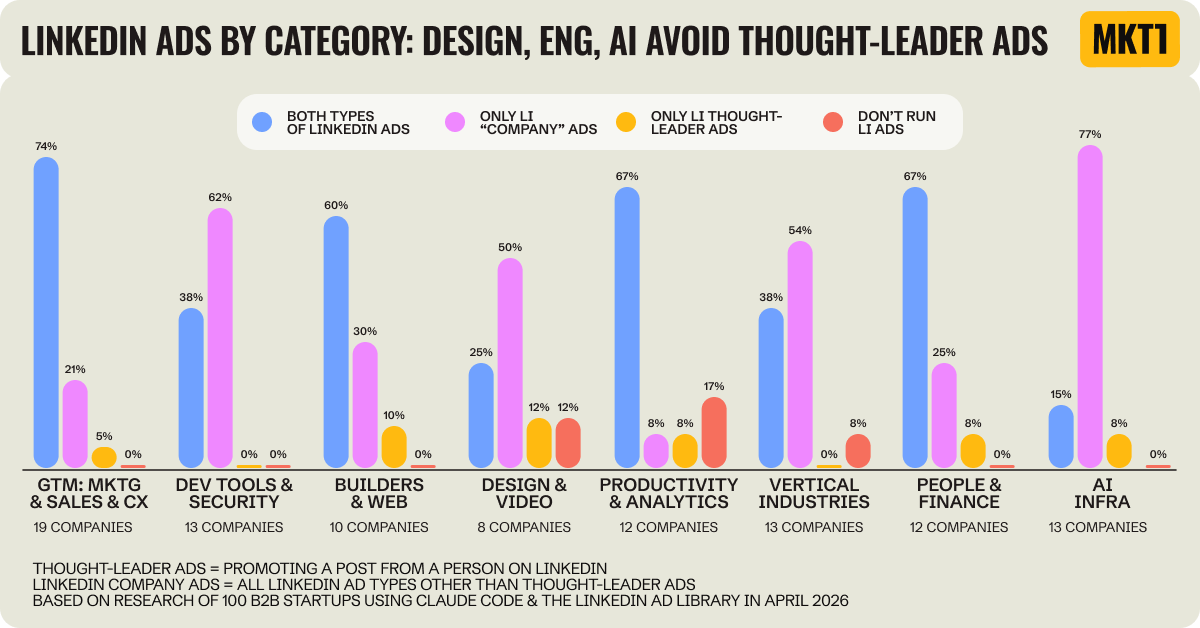
- Thought-leader ads (LinkedIn lets you run a paid ad that's actually a person's post, not the brand's) typically outperform regular brand ads. Adoption is 56% across the sample.
- GTM-category companies run thought-leader ads at 74% — many influencers in this space, brands amplifying their posts.
- Surprising mismatch: AI Models & Infra companies have the biggest founder LinkedIn followings (41K median, ~2x other categories) but the lowest TL-ad adoption (23%). Big personal brands sitting un-amplified.
- Outside AI Models & Infra, 70% of companies with above-median founder followings (>21.6K) run TL ads, vs 52% of those below median — confirming the link between personal brand size and paid amplification.
Social takeaways: LinkedIn is table stakes (96% running ads), so it isn't differentiation anymore. The real edge: who's growing founder followers and converting them into thought-leader ads (only 56% are). Twitter still works — but only for designers, builders, and product/dev audiences. Reddit and YouTube matter for technical buyers.
Part C — The State of Marketing "Fuel" (Content)
"Fuel" = blogs, events, communities, newsletters, podcasts.
Are we still leaning on blogs?
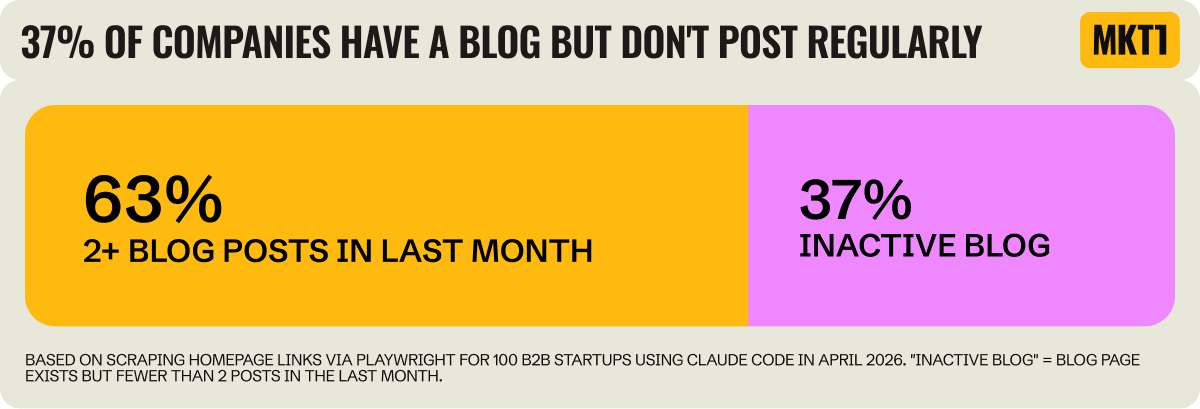
- 100% of B2B companies have a blog, but only 61% posted 2+ times last month. More than a third are running sleepy blogs.
- Dev Tools & Security is the surprise laggard — only 46% have an "active" blog. Likely because they publish to docs instead (Stripe, Datadog, Vercel all run massive doc sites that double as content engines).
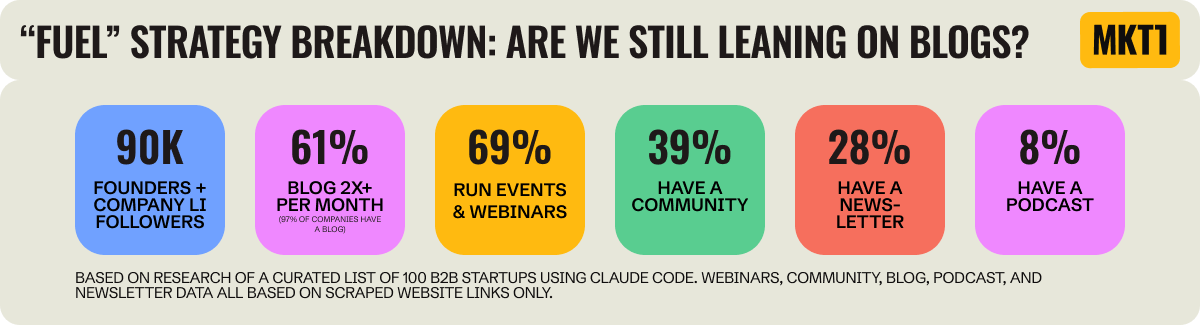
- Other channels (measured by whether the homepage or footer links to them — so undercount likely): events 69%, communities 39%, newsletters 28%, podcasts 8%.
- Sales-led companies over-index on events (78%) — long sales cycles + high contract values = relationship-building matters.
- Channel mix: only 1 company runs all 4 (events + community + newsletter + podcast). 20 companies run none. Most stick to 1–2.
- Communities and newsletters skew technical/creative. Among Builders, AI Infra, Dev Tools, and Design companies, 61% have a community, vs. just 23% in GTM/People&Finance/Vertical/Productivity. Builders & Web (70%) and AI Infra (62%) lead. People & Finance is at 0% — none of the 12 HR-ish companies in the sample run a community, despite the assumption that HR leaders crave one. Newsletter gap is similar (41% vs 18%).
LLMs are a distribution channel now — are our websites ready? (AEO)
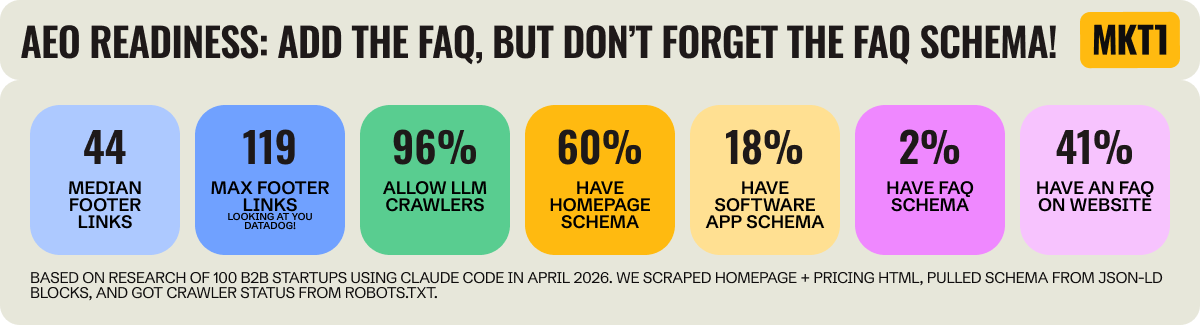
AEO = Answer Engine Optimization, i.e. making sure when people ask ChatGPT/Claude/Perplexity about your category, your site is parseable and citeable. Emily measured AEO readiness via several scrape-able signals:
- FAQ on the page: 41%
- FAQPage schema (structured markup that tells LLMs the FAQ is in Q&A format — see schema.org): just 2%
- Organization + SoftwareApplication schema: 18%
- robots.txt rules for LLM crawlers
- Footer links as a proxy for internal linking depth (median = 44; Datadog tops at 119)
Conclusion: less than 2% of B2B startups have all the AEO basics in place.
- 97% let LLM crawlers in. Only 3 block GPTBot and 2 block ClaudeBot. Attio does something clever: blocks CCBot (which feeds Common Crawl, the source of most LLM training data) but allows GPTBot and ClaudeBot. Translation: don't train on us, but do cite us in real time.
- FAQ text is everywhere; FAQ schema is nowhere. Only Puzzle and Klaviyo have both. This is the easiest AEO fix on the list — adding FAQ schema takes ~15 minutes and makes the content reliably machine-readable.
- FAQs are most common in self-serve GTM motions (71%) and the Builders & Web category (60%). Most behind: Dev Tools (15%) and Vertical Industries (31%).
Fuel takeaways: Cranking out blog posts isn't enough anymore. Communities and newsletters are popular for technical/design audiences (61% vs 23%), events are the sales-led play (78%), and AEO is universally underinvested in (under 2% have the basics). Blogs are sliding from "must-have" toward "occasional update."
Big Picture
- Web: B2B sites are migrating from custom code → all-in-one → headless CMS as marketing teams scale, and pricing/product transparency correlates strongly with GTM motion. Sales-led teams' instinct to hide everything is increasingly costly as buyers (and the LLMs they're using as buying assistants) demand specifics.
- Social: LinkedIn is no longer differentiation; the lever is founder voice + thought-leader ads. Twitter persists for technical/creative audiences only.
- Content: Blogs are quietly fading; events, communities, and newsletters pick up the slack — but each channel suits a specific audience. AEO is the next SEO and almost no one is ready.
Part 3 (next week) will cover Emily's playbook for using Claude Code to do this kind of research and ship it as a reusable skill.
Author
Emily Kramer
Continued reading
Keep your momentum

The AI Corner
The AI Agent That Thinks Like Jensen Huang, Elon Musk, and Dario Amodei
Dominguez opens with a claim that is easy to skim past but worth stopping on: the difference between elite founders and everyone else is not raw IQ or speed — it is that each of them has internalized a repeatable mental procedure they run on every important decision. The procedur
Apr 27 · 6m
Lenny's Newsletter (Lenny's Podcast)
Why Half of Product Managers Are in Trouble — Nikhyl Singhal on the AI Reinvention Threshold
Nikhyl Singhal is a serial founder and a former senior product executive at Meta, Google, and Credit Karma . Today he runs The Skip ( skip.show (https://skip.show)), a community for senior product leaders, plus offshoots like Skip Community , Skip Coach , and Skip.help . Lenny de
Apr 27 · 7m

Simon Willison's Newsletter
Qwen3.6‑35B‑A3B on my laptop drew me a better pelican than Claude Opus 4.7
Two big model releases dropped on the same morning: Qwen3.6‑35B‑A3B from Alibaba (an open‑weights model) and Claude Opus 4.7 from Anthropic (a closed, frontier proprietary model). Simon ran his long‑running joke benchmark — "Generate an SVG of a pelican riding a bicycle" — on bot
Apr 27 · 11m